Market Breadth - [JTCAPITAL]Market Breadth - is a comprehensive crypto market strength and sentiment indicator designed to visualize the overall bullish or bearish alignment across 40 major cryptocurrencies. By combining multi-asset Exponential Moving Average (EMA) comparisons and smoothing techniques, it offers a clean, aggregated view of the broader market trend—helping traders quickly assess whether the market is dominated by bullish momentum or bearish pressure.
The indicator works by calculating in the following steps:
Symbol Selection and Data Retrieval
The script monitors 40 leading cryptocurrencies based on Market Cap. Each asset’s daily close price is requested using a 1D timeframe. This ensures that every data point reflects the same temporal resolution, allowing the indicator to evaluate global crypto strength rather than individual token volatility.
EMA Comparison per Asset
For each asset, two Exponential Moving Averages (EMAs) are calculated:
A short-term EMA with period emalength (default 10).
A long-term EMA with period emalength2 (default 20).
Each coin receives a score of +1 when the short-term EMA is greater than the long-term EMA (indicating bullish structure), or -1 when it is below (indicating bearish structure). This binary scoring system effectively converts individual price action into a directional sentiment measure.
Market Breadth Aggregation
All 40 individual scores are summed into a single composite value called scores .
If many assets have bullish EMA alignment, the total score becomes strongly positive.
If the majority show bearish alignment, the total score turns negative.
This step transforms scattered price data into one unified market breadth metric—quantifying how many assets participate in the same directional trend.
Smoothing the Breadth Line
To reduce short-term noise and isolate trend direction, the aggregated score is smoothed using an EMA of length = smoothlen (default 15). The resulting smoothed line helps identify sustained shifts in collective sentiment rather than temporary fluctuations.
Visualization and Color Coding
When scores > 0 , the market breadth is bullish and the histogram is colored blue.
When scores < 0 , the breadth turns bearish and the histogram is purple.
The same logic applies to the smoothed line and background color, offering an instant visual cue of market mood transitions.
Buy and Sell Conditions:
The indicator itself does not trigger direct buy/sell signals but rather acts as a market regime filter . Traders can use it as follows:
Buy Filter: When the smoothed value is above zero and rising, the majority of assets confirm an uptrend — this favors long setups or trend continuation entries.
Sell Filter: When the smoothed value is below zero and falling, bearish alignment dominates — ideal for short setups or defensive risk management.
Optional filters could include combining this with RSI or volume-weighted momentum indicators to confirm breadth-based reversals.
Features and Parameters:
emalength – Defines the short-term EMA length used for individual asset trend detection (default 10).
emalength2 – Defines the long-term EMA length (default 20).
smoothlen – Defines the smoothing EMA length for the total market breadth line (default 15).
40 asset inputs – User-editable symbols allow full customization of which cryptos are tracked.
Dynamic color backgrounds – Visual distinction between bullish and bearish phases.
Specifications:
Exponential Moving Average (EMA)
EMA is a type of moving average that places more weight on recent price data, responding faster to market changes compared to SMA. By comparing a short-term and long-term EMA, the indicator captures momentum shifts across each asset individually. The crossover logic (EMA10 > EMA20) signals bullish conditions, while the opposite indicates bearish momentum.
Market Breadth
Market Breadth quantifies how many assets are participating in a directional move. Instead of tracking a single coin’s trend, breadth analysis measures collective sentiment. When most coins’ short-term EMAs are above long-term EMAs, the market shows healthy bullish breadth. Conversely, when most are below, weakness dominates.
Smoothing (EMA on Scores)
After summing the breadth score, the result is smoothed with an additional EMA to mitigate the inherent volatility caused by individual coin reversals. This second-level smoothing transforms raw fluctuations into a readable, trend-consistent curve.
Color Visualization
Visual cues are integral for intuitive interpretation.
Blue Shades: Indicate bullish alignment and collective upward momentum.
Purple Shades: Indicate bearish conditions and potential risk-off phases.
The background tint reinforces visual clarity even when the indicator is overlaid on price charts.
Background Logic
By applying the same color logic to the chart’s background, users can instantly recognize the prevailing market phase.
Use Cases
As a trend confirmation filter for other indicators (e.g., trade only in the direction of positive breadth).
As a divergence tool : when price rises but breadth weakens, it may signal a topping market.
As a macro sentiment monitor : perfect for assessing when the crypto market as a whole transitions from bearish to bullish structure.
Summary
“ Market Breadth - ” transforms the chaotic price movements of 40 cryptocurrencies into a single, powerful visual representation of overall market health. By merging EMA cross analysis with market-wide aggregation and smoothing , it provides traders with a deep understanding of when bullish or bearish forces dominate the ecosystem.
It’s a clean, data-driven approach to identifying shifts in crypto market sentiment — a perfect companion for trend-following, macro analysis, and timing portfolio exposure.
Enjoy!
Search in scripts for "Exponential Moving Average"

Robust Scaled Dema | OquantOverview
The Robust Scaled DEMA indicator is a tool designed for traders seeking to identify potential trend directions in financial markets. It combines the smoothing capabilities of a Double Exponential Moving Average (DEMA) with a robust scaling mechanism to normalize the data, making it more resilient to outliers and extreme price movements. This scaling helps in generating long and short signals based on predefined thresholds, visualized through color-coded plots and bars. The indicator aims to provide a balanced view of market momentum, reducing the impact of noise while highlighting significant shifts in price behavior.
Key Factors/Components
DEMA (Double Exponential Moving Average): Serves as the core smoothing component, reducing lag compared to simple averages by emphasizing recent price action more effectively.
Robust Scaling Mechanism: Utilizes statistical measures like median and interquartile range to normalize the DEMA values, ensuring the indicator is less sensitive to extreme values or price spikes.
Thresholds: User-defined upper and lower levels that trigger long or short signals when the scaled DEMA crosses them.
Visual Elements: Includes plotted lines for the scaled DEMA and thresholds, plus color-coded candlestick bars for intuitive interpretation.
Alerts: Built-in conditions for notifying users of potential entry points for long or short positions.
How It Works
The indicator starts by applying a DEMA to the chosen price source to create a smoothed representation of the market's direction. This smoothed value is then scaled using a robust statistical approach that accounts for the distribution of recent DEMA values, centering it around a median and adjusting for variability to minimize the influence of outliers. The resulting scaled metric is compared against user-set upper and lower thresholds: crossing above the upper suggests a bullish momentum (long signal), while dipping below the lower indicates bearish conditions (short signal). A state variable tracks these conditions to color the chart accordingly, helping traders visualize regime changes. Optional alerts fire on transitions.
For Who Is Best/Recommended Use Cases
This indicator is ideal for traders who employ trend-following or momentum-based strategies and need tools that perform well in non-normal market conditions, such as during high volatility or in assets prone to spikes. Use cases include identifying entry/exit points in trending environments, confirming breakouts, or integrating into multi-indicator systems for added confirmation. Quantitative traders or those backtesting strategies will appreciate its customizable parameters for optimization.
Settings and Default Settings
Source: The price data input for calculations, such as close, open, high, or low. Default: close.
DEMA Length: Controls the period for the DEMA smoothing; shorter values increase responsiveness but may add noise, longer ones provide more lag but smoother signals. Default: 25.
Robust Scaling Length: Defines the lookback period for the scaling statistics; affects how adaptive the normalization is to recent data distributions. Default: 40.
Upper Threshold: The level above which a long signal is triggered; higher values make signals rarer but potentially more reliable. Default: 0.5.
Lower Threshold: The level below which a short signal is triggered; lower values allow for more aggressive bearish detection. Default: 0.
Conclusion
The Robust Scaled DEMA offers an outlier-resistant alternative to traditional moving average indicators, empowering traders to navigate volatile markets. By blending exponential smoothing with statistical robustness, it provides actionable insights into trend shifts while minimizing false positives from extreme events..
⚠️ Disclaimer: This indicator is intended for educational and informational purposes only. Trading/investing involves risk, and past performance does not guarantee future results. Always test and evaluate indicators/strategies before applying them in live markets. Use at your own risk.

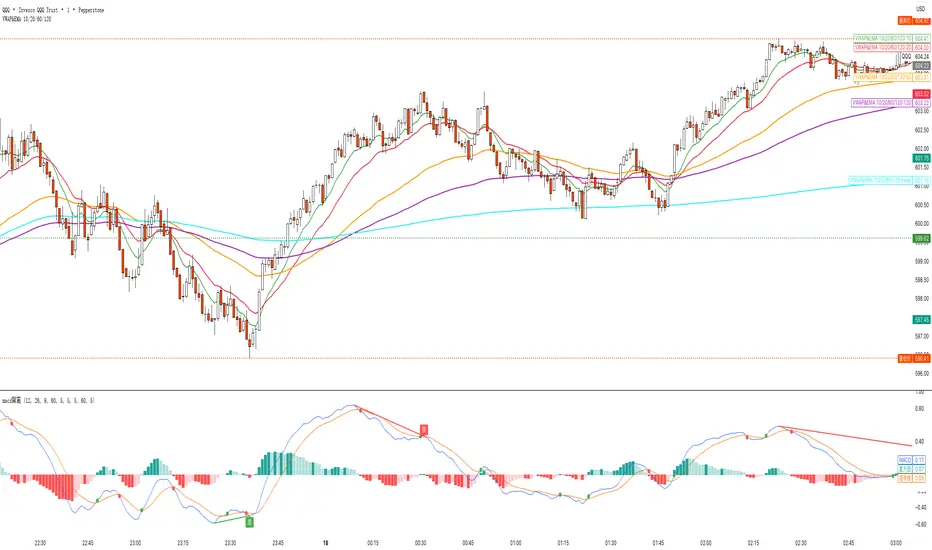
VWAP&EMA 10/20/60/120his script is a clean and straightforward technical analysis tool designed to provide traders with a clear view of market trends and key price levels by overlaying five essential moving averages onto your chart:
Volume Weighted Average Price (VWAP)
Four (4) Exponential Moving Averages (EMAs) at lengths 10, 20, 60, and 120.
By combining these indicators, traders can quickly assess short-term momentum, medium-term trends, and long-term direction, all while referencing the volume-weighted average price as a key benchmark for institutional activity.
Features & Components
This indicator plots five distinct lines on your chart, each color-coded for easy identification:
VWAP (Volume Weighted Average Price)
Plot: Plotted as a bright blue line.
Purpose: The VWAP represents the true average price of an asset for the day (or session), weighted by volume. It is a critical level for many day traders and institutions.
Prices above VWAP are often considered bullish.
Prices below VWAP are often considered bearish.
It frequently acts as a dynamic level of support or resistance.
EMA 10 (Short-Term Momentum)
Plot: Plotted as a green line.
Purpose: This is the fastest-moving average, reflecting the most recent price action and short-term momentum.
EMA 20 (Short-Term Trend)
Plot: Plotted as a red line.
Purpose: Often used in conjunction with the EMA 10, this average helps confirm the immediate trend. Crossovers between the 10 and 20 EMAs can signal potential entry or exit points.
EMA 60 (Medium-Term Trend)
Plot: Plotted as an orange line.
Purpose: This average provides a clearer picture of the medium-term trend, filtering out much of the short-term noise. It often serves as a significant dynamic support or resistance level.
EMA 120 (Long-Term Trend)
Plot: Plotted as a purple line.
Purpose: This is the slowest-moving average in the script, defining the major underlying trend. As long as the price remains above the EMA 120, the long-term bias is generally considered bullish, and vice-versa.
How to Use This Indicator
This indicator is versatile and can be adapted to various trading strategies:
Trend Confirmation: Use the alignment of the EMAs to determine the trend.
Strong Bullish Trend: Price > EMA 10 > EMA 20 > EMA 60 > EMA 120.
Strong Bearish Trend: Price < EMA 10 < EMA 20 < EMA 60 < EMA 120.
Dynamic Support & Resistance: Watch how the price reacts to each of the five lines. In an uptrend, the EMAs and VWAP will often act as "bounces" or support levels for pullbacks. In a downtrend, they will act as resistance.
Entry & Exit Signals (Crossovers):
A bullish crossover (e.g., EMA 10 crossing above EMA 20) can signal buying interest.
A bearish crossover (e.g., EMA 10 crossing below EMA 20) can signal selling pressure.
VWAP Confluence: Pay special attention to areas where an EMA (like the 20 or 60) crosses or travels close to the VWAP. This "confluence" can create a very strong and significant price level. For example, if the price pulls back to the VWAP and also finds support at the EMA 60, it can be a high-probability trade setup.
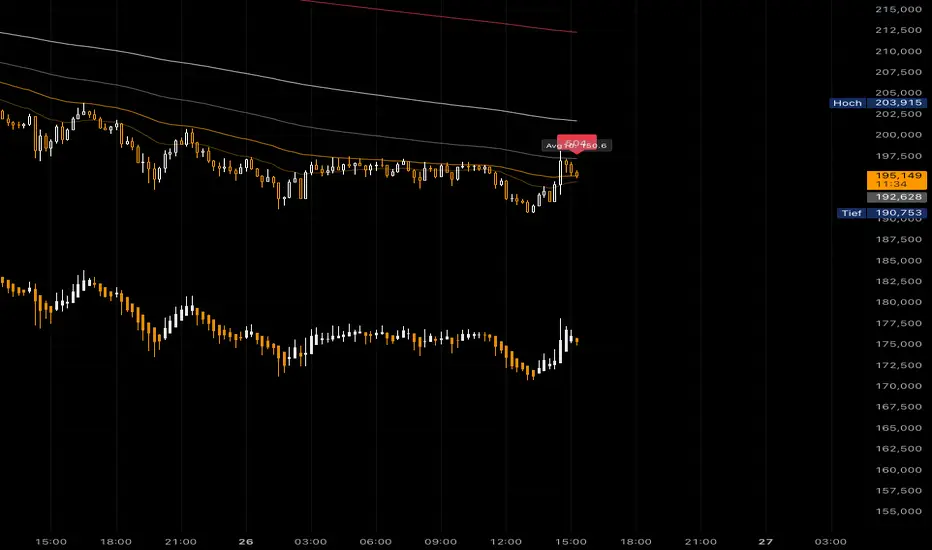
AMHA + 4 EMAs + EMA50/200 Counter + Avg10CrossesDescription:
This script combines two types of Heikin-Ashi visualization with multiple Exponential Moving Averages (EMAs) and a counting function for EMA50/200 crossovers. The goal is to make trends more visible, measure recurring market cycles, and provide statistical context without generating trading signals.
Logic in Detail:
Adaptive Median Heikin-Ashi (AMHA):
Instead of the classic Heikin-Ashi calculation, this method uses the median of Open, High, Low, and Close. The result smooths out price movements, emphasizes trend direction, and reduces market noise.
Standard Heikin-Ashi Overlay:
Classic HA candles are also drawn in the background for comparison and transparency. Both HA types can be shifted below the chart’s price action using a customizable Offset (Ticks) parameter.
EMA Structure:
Five exponential moving averages (21, 50, 100, 200, 500) are included to highlight different trend horizons. EMA50 and EMA200 are emphasized, as their crossovers are widely monitored as potential trend signals. EMA21 and EMA100 serve as additional structure layers, while EMA500 represents the long-term trend.
EMA50/200 Counter:
The script counts how many bars have passed since the last EMA50/200 crossover. This makes it easy to see the age of the current trend phase. A colored label above the chart displays the current counter.
Average of the Last 10 Crossovers (Avg10Crosses):
The script stores the last 10 completed count phases and calculates their average length. This provides historical context and allows traders to compare the current cycle against typical past behavior.
Benefits for Analysis:
Clearer trend visualization through adaptive Heikin-Ashi calculation.
Multi-EMA setup for quick structural assessment.
Objective measurement of trend phase duration.
Statistical insight from the average cycle length of past EMA50/200 crosses.
Flexible visualization through adjustable offset positioning below the price chart.
Usage:
Add the indicator to your chart.
For a clean look, you may switch your chart type to “Line” or hide standard candlesticks.
Interpret visual signals:
White candles = bullish phases
Orange candles = bearish phases
EMAs = structural trend filters (e.g., EMA200 as a long-term boundary)
The counter label shows the current number of bars since the last cross, while Avg10 represents the historical mean.
Special Feature:
This script is not a trading system. It does not provide buy/sell recommendations. Instead, it serves as a visual and statistical tool for market structure analysis. The unique combination of Adaptive Median Heikin-Ashi, multi-EMA framework, and EMA50/200 crossover statistics makes it especially useful for trend-followers and swing traders who want to add cycle-length analysis to their toolkit.
Standardized Cumulative Deltas [LuxAlgo]The Standardized Cumulative Deltas tool allows traders to compare the cumulative standardized open-close difference for up to 10 different tickers, allowing them to visualize the general sentiment for all selected tickers.
These results allow the construction of two areas showing the average or extreme bullish and bearish cumulative change for all enabled tickers, providing a summarized view of the overall ticker group sentiment.
🔶 USAGE
This tool is meant to give a full picture of the individuals and/or overall selected tickers, and unlike classical indicators, the displayed series of values is not meant to be directly interpreted over time.
Given the selected lookback period, a majority of observations being above 0 indicate an overall bullish market for the asset.
By default, the auto lookback period feature is enabled, allowing the tool to use all the visible bars for its calculations. Traders can also set the lookback period manually. The above chart uses a fixed lookback period of 500.
Up to 10 tickers can be used. While major cryptocurrencies are set by default, the users can set a specific basket of assets, such as US equities, forex pairs, commodities, etc.
🔹 Densities
The provided areas, here called densities, can be used to get an overall sentiment of the selected tickers. The upper density (bullish) processes positive deltas, while the lower one (bearish) processes negative ones.
Interpretation is subject to the selected "Density Mode".
Average: Densities track the average bullish/bearish cumulative deltas for the selected tickers. For example, a more prominent bullish density would indicate that, on average, cumulative deltas were positive across the tickers.
Envelope: Densities track the extreme values made by bullish/bearish cumulative deltas for the selected tickers. Here, a more prominent density would indicate more volatile bullish/bearish movements, depending on the density.
🔹 Dashboard
The tool features a dashboard with active tickers and their respective colors for traders' convenience.
🔶 DETAILS
🔹 Densities
Densities are obtained by applying a forward-backward exponential moving average on the average, or the highest/lowest cumulative series, depending on the selected Density Mode.
The resulting densities are smoothed by the "Smoothing" parameter located in the Settings panel, with higher values returning smoother envelopes with less variability.
Do note that the smoothing method used here is subject to repainting.
🔶 SETTINGS
Lookback: Select the lookback period and enable/disable the Auto Lookback feature
Tickers: Enable/disable and select up to 10 tickers and their colors
Density Mode: Determine how densities are calculated
🔹 Dashboard
Show Dashboard: Enable/disable the dashboard
Position: Select the dashboard position
Size: Select the dashboard size
🔹 Style
Density: Enable/disable the density areas
Bullish Density: Select the color of the top density area
Bearish Density: Select the color of the bottom density area
Smoothing: Select the smoothing constant for the EMA calculation

Advanced Trend Momentum [Alpha Extract]The Advanced Trend Momentum indicator provides traders with deep insights into market dynamics by combining exponential moving average analysis with RSI momentum assessment and dynamic support/resistance detection. This sophisticated multi-dimensional tool helps identify trend changes, momentum divergences, and key structural levels, offering actionable buy and sell signals based on trend strength and momentum convergence.
🔶 CALCULATION
The indicator processes market data through multiple analytical methods:
Dual EMA Analysis: Calculates fast and slow exponential moving averages with dynamic trend direction assessment and ATR-normalized strength measurement.
RSI Momentum Engine: Implements RSI-based momentum analysis with enhanced overbought/oversold detection and momentum velocity calculations.
Pivot-Based Structure: Identifies and tracks dynamic support and resistance levels using pivot point analysis with configurable level management.
Signal Integration: Combines trend direction, momentum characteristics, and structural proximity to generate high-probability trading signals.
Formula:
Fast EMA = EMA(Close, Fast Length)
Slow EMA = EMA(Close, Slow Length)
Trend Direction = Fast EMA > Slow EMA ? 1 : -1
Trend Strength = |Fast EMA - Slow EMA| / ATR(Period) × 100
RSI Momentum = RSI(Close, RSI Length)
Momentum Value = Change(Close, 5) / ATR(10) × 100
Pivot Support/Resistance = Dynamic pivot arrays with configurable lookback periods
Bullish Signal = Trend Change + Momentum Confirmation + Strength > 1%
Bearish Signal = Trend Change + Momentum Confirmation + Strength > 1%
🔶 DETAILS
Visual Features:
Trend EMAs: Fast and slow exponential moving averages with dynamic color coding (bullish/bearish)
Enhanced RSI: RSI oscillator with color-coded zones, gradient fills, and reference bands at overbought/oversold levels
Trend Fill: Dynamic gradient between EMAs indicating trend strength and direction
Support/Resistance Lines: Horizontal levels extending from pivot-based calculations with configurable maximum levels
Momentum Candles: Color-coded candlestick overlay reflecting combined trend and momentum conditions
Divergence Markers: Diamond-shaped signals highlighting bullish and bearish momentum divergences
Analysis Table: Real-time summary of trend direction, strength percentage, RSI value, and momentum reading
Interpretation:
Trend Direction: Bullish when Fast EMA crosses above Slow EMA with strength confirmation
Trend Strength > 1%: Strong trending conditions with institutional participation
RSI > 70: Overbought conditions, potential selling opportunity
RSI < 30: Oversold conditions, potential buying opportunity
Momentum Divergence: Price and momentum moving opposite directions signal potential reversals
Support/Resistance Proximity: Dynamic levels provide optimal entry/exit zones
Combined Signals: Trend changes with momentum confirmation generate high-probability opportunities
🔶 EXAMPLES
Trend Confirmation: Fast EMA crossing above Slow EMA with trend strength exceeding 1% and positive momentum confirms strong bullish conditions.
Example: During institutional accumulation phases, EMA crossovers with momentum confirmation have historically preceded significant upward moves, providing optimal long entry points.
15min
4H
Momentum Divergence Detection: RSI reaching overbought levels while momentum decreases despite rising prices signals potential trend exhaustion.
Example: Bearish divergence signals appearing at resistance levels have marked major market tops, allowing traders to secure profits before corrections.
Support/Resistance Integration: Dynamic pivot-based levels combined with trend and momentum signals create high-probability trading zones.
Example: Bullish trend changes occurring near established support levels offer optimal risk-reward entries with clearly defined stop-loss levels.
Multi-Dimensional Confirmation: The indicator's combination of trend, momentum, and structural analysis provides comprehensive market validation.
Example: When trend direction aligns with momentum characteristics near key structural levels, the confluence creates institutional-grade trading opportunities with enhanced probability of success.
🔶 SETTINGS
Customization Options:
Trend Analysis: Fast EMA Length (default: 12), Slow EMA Length (default: 26), Trend Strength Period (default: 14)
Support & Resistance: Pivot Length for level detection (default: 10), Maximum S/R Levels displayed (default: 3), Toggle S/R visibility
Momentum Settings: RSI Length (default: 14), Oversold Level (default: 30), Overbought Level (default: 70)
Visual Configuration: Color schemes for bullish/bearish/neutral conditions, transparency settings for fills, momentum candle overlay toggle
Display Options: Analysis table visibility, divergence marker size, alert system configuration
The Advanced Trend Momentum indicator provides traders with comprehensive insights into market dynamics through its sophisticated integration of trend analysis, momentum assessment, and structural level detection. By combining multiple analytical dimensions into a unified framework, this tool helps identify high-probability opportunities while filtering out market noise through its multi-confirmation approach, enabling traders to make informed decisions across various market cycles and timeframes.

Volume-Weighted Money Flow [sgbpulse]Overview
The VWMF indicator is an advanced technical analysis tool that combines and summarizes five leading momentum and volume indicators (OBV, PVT, A/D, CMF, MFI) into one clear oscillator. The indicator helps to provide a clear picture of market sentiment by measuring the pressure from buyers and sellers. Unlike single indicators, VWMF provides a comprehensive view of market money flow by weighting existing indicators and presenting them in a uniform and understandable format.
Indicator Components
VWMF combines the following indicators, each normalized to a range of 0 to 100 before being weighted:
On-Balance Volume (OBV): A cumulative indicator that measures positive and negative volume flow.
Price-Volume Trend (PVT): Similar to OBV, but incorporates relative price change for a more precise measure.
Accumulation/Distribution Line (A/D): Used to identify whether an asset is being bought (accumulated) or sold (distributed).
Chaikin Money Flow (CMF): Measures the money flow over a period based on the close price's position relative to the candle's range.
Money Flow Index (MFI): A momentum oscillator that combines price and volume to measure buying and selling pressure.
Understanding the Normalized Oscillators
The indicator combines the five different momentum indicators by normalizing each one to a uniform range of 0 to 100 .
Why is Normalization Important?
Indicators like OBV, PVT, and the A/D Line are cumulative indicators whose values can become very large. To assess their trend, we use a Moving Average as a dynamic reference line . The Moving Average allows us to understand whether the indicator is currently trending up or down relative to its average behavior over time.
How Does Normalization Work?
Our normalization fully preserves the original trend of each indicator.
For Cumulative Indicators (OBV, PVT, A/D): We calculate the difference between the current indicator value and its Moving Average. This difference is then passed to the normalization process.
- If the indicator is above its Moving Average, the difference will be positive, and the normalized value will be above 50.
- If the indicator is below its Moving Average, the difference will be negative, and the normalized value will be below 50.
Handling Extreme Values: To overcome the issue of extreme values in indicators like OBV, PVT, and the A/D Line , the function calculates the highest absolute value over the selected period. This value is used to prevent sharp spikes or drops in a single indicator from compromising the accuracy of the normalization over time. It's a sophisticated method that ensures the oscillators remain relevant and accurate.
For Bounded Indicators (CMF, MFI): These indicators already operate within a known range (for example, CMF is between -1 and 1, and MFI is between 0 and 100), so they are normalized directly without an additional reference line.
Reference Line Settings:
Moving Average Type: Allows the user to choose between a Simple Moving Average (SMA) and an Exponential Moving Average (EMA).
Volume Flow MA Length: Allows the user to set the lookback period for the Moving Average, which affects the indicator's sensitivity.
The 50 line serves as the new "center line." This ensures that, even after normalization, the determination of whether a specific indicator supports a bullish or bearish trend remains clear.
Settings and Visual Tools
The indicator offers several customization options to provide a rich analysis experience:
VWMF Oscillator (Blue Line): Represents the weighted average of all five indicators. Values above 50 indicate bullish momentum, and values below 50 indicate bearish momentum.
Strength Metrics (Bullish/Bearish Strength %): Two metrics that appear on the status line, showing the percentage of indicators supporting the current trend. They range from 0% to 100%, providing a quick view of the strength of the consensus.
Dynamic Background Colors: The background color of the chart automatically changes to bullish (a blue shade by default) or bearish (a default brown-gray shade) based on the trend. The transparency of the color shows the consensus strength—the more opaque the background, the more indicators support the trend.
Advanced Settings:
- Background Color Logic: Allows the user to choose the trigger for the background color: Weighted Value (based on the combined oscillator) or Strength (based on the majority of individual indicators).
- Weights: Provides full control over the weight of each of the five indicators in the final oscillator.
Using the Data Window
TradingView provides a useful Data Window that allows you to see the exact numerical values of each normalized oscillator separately, in addition to the trend strength data.
You can use this window to:
Get more detailed information on each indicator: Viewing the precise numerical data of each of the five indicators can help in making trading decisions.
Calibrate weights: If you want to manually adjust the indicator weights (in the settings menu), you can do so while tracking the impact of each indicator on the weighted oscillator in the Data Window.
The indicator's default setting is an equal weight of 20% for each of the five indicators.
Alert Conditions
The indicator comes with a variety of built-in alerts that can be configured through the TradingView alerts menu:
VWMF Cross Above 50: An alert when the VWMF oscillator crosses above the 50 line, indicating a potential bullish momentum shift.
VWMF Cross Below 50: An alert when the VWMF oscillator crosses below the 50 line, indicating a potential bearish momentum shift.
Bullish Strength: High But Not Absolute Consensus: An alert when the bullish trend strength reaches 60% or more but is less than 100%, indicating a high but not absolute consensus.
Bullish Strength at 100%: An alert when all five indicators (MFI, OBV, PVT, A/D, CMF) show bullish strength, indicating a full and absolute consensus.
Bearish Strength: High But Not Absolute Consensus: An alert when the bearish trend strength reaches 60% or more but is less than 100%, indicating a high but not absolute consensus.
Bearish Strength at 100%: An alert when all five indicators (MFI, OBV, PVT, A/D, CMF) show bearish strength, indicating a full and absolute consensus.
Summary
The VWMF indicator is a powerful, all-in-one tool for analyzing market momentum, money flow, and sentiment. By combining and normalizing five different indicators into a single oscillator, it offers a holistic and accurate view of the market's underlying trend. Its dynamic visual features and customizable settings, including the ability to adjust indicator weights, provide a flexible experience for both novice and experienced traders. The built-in alerts for momentum shifts and trend consensus make it an effective tool for spotting trading opportunities with confidence. In essence, VWMF distills complex market data into clear, actionable signals.
Important Note: Trading Risk
This indicator is intended for educational and informational purposes only and does not constitute investment advice or a recommendation for trading in any form whatsoever.
Trading in financial markets involves significant risk of capital loss. It is important to remember that past performance is not indicative of future results. All trading decisions are your sole responsibility. Never trade with money you cannot afford to lose.

[Pandora][Swarm] Rapid Exponential Moving AverageENVISIONING POSSIBILITY
What is the theoretical pinnacle of possibility? The current state of algorithmic affairs falls far short of my aspirations for achievable feasibility. I'm lifting the lid off of Pandora's box once again, very publicly this time, as a brute force challenge to conventional 'wisdom'. The unfolding series of time mandates a transcendental systemic alteration...
THE MOVING AVERAGE ZOO:
The realm of digital signal processing for trading is filled with familiar antiquated filtering tools. Two families of filtration, being 'infinite impulse response' (EMA, RMA, etc.) and 'finite impulse response' (WMA, SMA, etc.), are prevalently employed without question. These filter types are the mules and donkeys of data analysis, broadly accepted for use in finance.
At first glance, they appear sufficient for most tasks, offering a basic straightforward way to reduce noise and highlight trends. Yet, beneath their simplistic facade lies a constellation of limitations and impediments, each having its own finicky quirks. Upon closer inspection, identifiable drawbacks render them far from ideal for many real-world applications in today's volatile markets.
KNOWN FUNDAMENTAL FLAWS:
Despite commonplace moving average (MA) popularity, these conventional filters suffer from an assortment of fundamental flaws. Most of them don't genuinely address core challenges of how to preserve the true dynamics of a signal while suppressing noise and retaining cutoff frequency compliance. Their simple cookie cutter structures make them ill-suited in actuality for dynamic market environments. In reality, they often trade one problem for another dilemma, forsaking analytics to choose between distortion and delay.
A deeper seeded issue remains within frequency compliance, how adequately a filter respects (or disrespects) the underlying signal’s spectral properties according to it's assigned periodic parameter. Traditional MAs habitually distort phase relationships, causing delayed reactions with surplus lag or exaggerations with excessive undershoot/overshoot. For applications requiring timely resilience, such as algorithmic trading, these shortcomings are often functionally unacceptable. What’s needed is vigorous filters that can more accurately retain signal behaviors while minimizing lag without sacrificing smoothness and uniformity. Until then, the public MA zoo remains as a collection of corny compromises, rather than a favorable toolbelt of solutions.
P.S.: In PSv7+, in my opinion, many of these geriatric MAs deserve no future with ease of access for the naive, simply not knowing these filters are most likely creating bigger problems than solving any.
R.E.M.A.
What is this? I prefer to think of it as the "radical EMA", definitely along my lines of a retire everything morte algorithm. This isn't your run of the mill average from the petting zoo. I would categorize it as a paradigm shifting rampant economic masochistic annihilator, sufficiently good enough to begin ruthlessly executing moving averages left and right. Um, yeah... that kind of moving average destructor as you may soon recognize with a few 'Filters+' settings adjustments, realizing ordinary EMA has been doing us an injustice all this time.
Does it possess the capability to relentlessly exterminate most averaging filters in existence? Well, it's about time we find out, by uncaging it on the loose into the greater economic wilderness. Only then can we truly find out if it is indeed a radical exponential market accelerant whose time has come. If it is, then it may eventually become a reality erasing monolithic anomaly destined for greatness, ultimately changing the entire landscape of trading in perpetuity.
UNLEASHING NEXT-GEN:
This lone next generation exoweapon algorithm is intended to initiate the transformative beginning stages of mass filtration deprecation. However, it won't be the only one, just the first arrival of it's alien kind from me. Welcome to notion #1 of my future filtration frontier, on this episode of the algorithmic twilight zone. Where reality takes a twisting turn one dimension beyond practical logic, after persistent models of mindset disintegrate into insignificance, followed by illusory perception confronted into cognitive dissonance.
An evolutionary path to genuine advancement resides outside the prison of preconceptions, manifesting only after divergence from persistent binding restrictions of dogmatic doctrines. Such a genesis in transformative thinking will catalyze unbounded cognitive potential, plowing the way for the cultivation of total redesigns of thought. Futuristic innovative breakthroughs demand the surrender of legacy and outmoded understandings.
Now that the world's largest assembly of investors has been ensembled, there are additional tasks left to perform. I'm compelled to deploy this mathematical-weapon of mass financial creation into it's rightful destined hands, to "WE THE PEOPLE" of TV.
SCRIPT INTENTION:
Deprecate anything and everything as any non-commercial member sees desirably fit. This includes your existing code formulations already in working functional modes of operation AND/OR future projects in the works. Swapping is nearly as simple as copying and pasting with meager modifications, after you have identified comparable likeness in this indicators settings with a visual assessment. Results may become eye opening, but only if you dare to look and test.
Where you may suspect a ta.filter() is lacking sufficient luster or may be flat out majorly deficient, employing rema, drema, trema, or qrema configurations may be a more suitable replacement. That's up to you to discern. My code satire already identifies likely bottom of the barrel suspects that either belong in the extinction record or have already been marked for deprecation. They are ordered more towards the bottom by rank where they belong. SuperSmoother is a masterpiece here to stay, being my original go-to reference filter. Everything you see here is already deprecated, including REMA...
REMA CHARACTERISTICS
- VERY low lag
- No overshoot
- Frequency compliant
- Proper initialization at bar_index==0
- Period parameter accepts poitive floating point numerics (AND integers!)
- Infinite impulse response (IIR) filter
- Compact code footprint
- Minimized computational overhead

Ultimate Scalping Strategy v2Strategy Overview
This is a versatile scalping strategy designed primarily for low timeframes (like 1-min, 3-min, or 5-min charts). Its core logic is based on a classic EMA (Exponential Moving Average) crossover system, which is then filtered by the VWAP (Volume-Weighted Average Price) to confirm the trade's direction in alignment with the market's current intraday sentiment.
The strategy is highly customizable, allowing traders to add layers of confirmation, control trade direction, and manage exits with precision.
Core Strategy Logic
The strategy's entry signals are generated when two primary conditions are met simultaneously:
Momentum Shift (EMA Crossover): It looks for a crossover between a fast EMA (default length 9) and a slow EMA (default length 21).
Buy Signal: The fast EMA crosses above the slow EMA, indicating a potential shift to bullish momentum.
Sell Signal: The fast EMA crosses below the slow EMA, indicating a potential shift to bearish momentum.
Trend/Sentiment Filter (VWAP): The crossover signal is only considered valid if the price is on the "correct" side of the VWAP.
For a Buy Signal: The price must be trading above the VWAP. This confirms that, on average, buyers are in control for the day.
For a Sell Signal: The price must be trading below the VWAP. This confirms that sellers are generally in control.
Confirmation Filters (Optional)
To increase the reliability of the signals and reduce false entries, the strategy includes two optional confirmation filters:
Price Action Filter (Engulfing Candle): If enabled (Use Price Action), the entry signal is only valid if the crossover candle is also an "engulfing" candle.
A Bullish Engulfing candle is a large green candle that completely "engulfs" the body of the previous smaller red candle, signaling strong buying pressure.
A Bearish Engulfing candle is a large red candle that engulfs the previous smaller green candle, signaling strong selling pressure.
Volume Filter (Volume Spike): If enabled (Use Volume Confirmation), the entry signal must be accompanied by a surge in volume. This is confirmed if the volume of the entry candle is greater than its recent moving average (default 20 periods). This ensures the move has strong participation behind it.
Exit Strategy
A position can be closed in one of three ways, creating a comprehensive exit plan:
Stop Loss (SL): A fixed stop loss is set at a level determined by a multiple of the Average True Range (ATR). For example, a 1.5 multiplier places the stop 1.5 times the current ATR value away from the entry price. This makes the stop dynamic, adapting to market volatility.
Take Profit (TP): A fixed take profit is also set using an ATR multiplier. By setting the TP multiplier higher than the SL multiplier (e.g., 2.0 for TP vs. 1.5 for SL), the strategy aims for a positive risk-to-reward ratio on each trade.
Exit on Opposite Signal (Reversal): If enabled, an open position will be closed automatically if a valid entry signal in the opposite direction appears. For example, if you are in a long trade and a valid short signal occurs, the strategy will exit the long position immediately. This feature turns the strategy into more of a reversal system.
Key Features & Customization
Trade Direction Control: You can enable or disable long and short trades independently using the Allow Longs and Allow Shorts toggles. This is useful for trading in harmony with a higher-timeframe trend (e.g., only allowing longs in a bull market).
Visual Plots: The strategy plots the Fast EMA, Slow EMA, and VWAP on the chart for easy visualization of the setup. It also plots up/down arrows to mark where valid buy and sell signals occurred.
Dynamic SL/TP Line Plotting: A standout feature is that the strategy automatically draws the exact Stop Loss and Take Profit price lines on the chart for every active trade. These lines appear when a trade is entered and disappear as soon as it is closed, providing a clear visual of your risk and reward targets.
Alerts: The script includes built-in alertcondition calls. This allows you to create alerts in TradingView that can notify you on your phone or execute trades automatically via a webhook when a long or short signal is generated.

Custom EMA High/Low & SMA - [GSK-VIZAG-AP-INDIA] Custom EMA High/Low & SMA -
1. Overview
This indicator overlays a dynamic combination of Exponential Moving Averages (EMA) and Simple Moving Average (SMA) to identify momentum shifts and potential entry/exit zones. It highlights bullish or bearish conditions using color-coded SMA logic and provides visual Buy/Sell signals based on smart crossover and state-based logic.
2. Purpose / Use Case
Designed for traders who want to visually identify momentum breakouts, trend reversals, or pullback opportunities, this tool helps:
Spot high-probability buy/sell zones
Confirm price strength relative to volatility bands (EMA High/Low)
Time entries based on clean visual cues
It works well in trend-following strategies, particularly in intraday or swing setups across any liquid market (indices, stocks, crypto, etc.).
3. Key Features & Logic
✅ EMA High/Low Channel: Acts as dynamic support/resistance boundaries using 20-period EMAs on high and low prices.
✅ Timeframe-Specific SMA: A 33-period SMA calculated from a user-defined timeframe (default: 10-minute) for flexible multi-timeframe analysis.
✅ Signal Generation:
Buy: When SMA drops below EMA Low and close is above EMA High.
Sell: When SMA rises above EMA High and price closes below both EMAs.
Optionally, signals also fire based on SMA color changes (green = bullish, red = bearish).
✅ Strict or Loose Signal Logic: Choose between precise crossovers or broader state-based conditions.
✅ Debugging Tools: Optional markers for granular insight into condition logic.
4. User Inputs & Settings
Input Description
EMA High Length Period for EMA of high prices (default: 20)
EMA Low Length Period for EMA of low prices (default: 20)
SMA Length Period for Simple Moving Average (default: 33)
SMA Timeframe Timeframe for SMA (default: “10”)
Show Buy/Sell Arrows Enable visual arrow signals for Buy/Sell
Strict Signal Logic ON = crossover-based signals; OFF = state logic
Plot Signals on SMA Color Change Enable signals on SMA color shifts (Green/Red)
Show Debug Markers Plot small markers to debug condition logic
5. Visual Elements Explained
🔵 EMA High Line – Blue line marking dynamic resistance
🔴 EMA Low Line – Red line marking dynamic support
🟡 SMA Line – Color-coded based on position:
Green if SMA < EMA Low (Bullish)
Red if SMA > EMA High (Bearish)
Yellow otherwise (Neutral)
✅ BUY / SELL Labels – Displayed below or above candles on valid signals
🛠️ Debug Circles/Triangles – Help visually understand the signal logic when enabled
6. Usage Tips
Best used on 5–30 min timeframes for intraday setups or 1H+ for swing trades.
Confirm signals with volume, price action, or other confluences (like support/resistance).
Use strict mode for more accurate entries, and non-strict mode for broader trend views.
Ideal for identifying pullbacks into trend, or early reversals after volatility squeezes.
7. What Makes It Unique
Multi-timeframe SMA integrated with EMA High/Low bands
Dual signal logic (crossover + color shift)
Visually intuitive and beginner-friendly
Minimal clutter with dynamic signal labeling
Debug mode for transparency and learning
8. Alerts & Automation
The indicator includes built-in alert conditions for:
📈 Buy Alert: Triggered when a bullish condition is detected.
🔻 Sell Alert: Triggered when bearish confirmation is detected.
These alerts can be used with TradingView's alert system for real-time notifications or bot integrations.
9. Technical Concepts Used
EMA (Exponential Moving Average): Reacts faster to recent price, ideal for trend channels
SMA (Simple Moving Average): Smoother average for detecting general trend direction
Crossover Logic: Checks when SMA crosses over or under EMA levels
Color Coding: Visual signal enhancement based on relative positioning
Multi-Timeframe Analysis: SMA calculated on a custom timeframe, powerful for confirmation
10. Disclaimer
This script is for educational and informational purposes only. It is not financial advice. Always backtest thoroughly and validate on demo accounts before applying to live markets. Trading involves risk, and past performance does not guarantee future results.
11. Author Signature
📌 Indicator Name: Custom EMA High/Low & SMA -
👤 Author: GSK-VIZAG-AP-INDIA

Uptrick: Z-Trend BandsOverview
Uptrick: Z-Trend Bands is a Pine Script overlay crafted to capture high-probability mean-reversion opportunities. It dynamically plots upper and lower statistical bands around an EMA baseline by converting price deviations into z-scores. Once price moves outside these bands and then reenters, the indicator verifies that momentum is genuinely reversing via an EMA-smoothed RSI slope. Signal memory ensures only one entry per momentum swing, and traders receive clear, real-time feedback through customizable bar-coloring modes, a semi-transparent fill highlighting the statistical zone, concise “Up”/“Down” labels, and a live five-metric scoring table.
Introduction
Markets often oscillate between trending and reverting, and simple thresholds or static envelopes frequently misfire when volatility shifts. Standard deviation quantifies how “wide” recent price moves have been, and a z-score transforms each deviation into a measure of how rare it is relative to its own history. By anchoring these bands to an exponential moving average, the script maintains a fluid statistical envelope that adapts instantly to both calm and turbulent regimes. Meanwhile, the Relative Strength Index (RSI) tracks momentum; smoothing RSI with an EMA and observing its slope filters out erratic spikes, ensuring that only genuine momentum flips—upward for longs and downward for shorts—qualify.
Purpose
This indicator is purpose-built for short-term mean-reversion traders operating on lower–timeframe charts. It reveals when price has strayed into the outer 5 percent of its recent range, signaling an increased likelihood of a bounce back toward fair value. Rather than firing on price alone, it demands that momentum follow suit: the smoothed RSI slope must flip in the opposite direction before any trade marker appears. This dual-filter approach dramatically reduces noise-driven, false setups. Traders then see immediate visual confirmation—bar colors that reflect the latest signal and age over time, clear entry labels, and an always-visible table of metric scores—so they can gauge both the validity and freshness of each signal at a glance.
Originality and Uniqueness
Uptrick: Z-Trend Bands stands apart from typical envelope or oscillator tools in four key ways. First, it employs fully normalized z-score bands, meaning ±2 always captures roughly the top and bottom 5 percent of moves, regardless of volatility regime. Second, it insists on two simultaneous conditions—price reentry into the bands and a confirming RSI slope flip—dramatically reducing whipsaw signals. Third, it uses slope-phase memory to lock out duplicate signals until momentum truly reverses again, enforcing disciplined entries. Finally, it offers four distinct bar-coloring schemes (solid reversal, fading reversal, exceeding bands, and classic heatmap) plus a dynamic scoring table, rather than a single, opaque alert, giving traders deep insight into every layer of analysis.
Why Each Component Was Picked
The EMA baseline was chosen for its blend of responsiveness—weighting recent price heavily—and smoothness, which filters market noise. Z-score deviation bands standardize price extremes relative to their own history, adapting automatically to shifting volatility so that “extreme” always means statistically rare. The RSI, smoothed with an EMA before slope calculation, captures true momentum shifts without the false spikes that raw RSI often produces. Slope-phase memory flags prevent repeated alerts within a single swing, curbing over-trading in choppy conditions. Bar-coloring modes provide flexible visual contexts—whether you prefer to track the latest reversal, see signal age, highlight every breakout, or view a continuous gradient—and the scoring table breaks down all five core checks for complete transparency.
Features
This indicator offers a suite of configurable visual and logical tools designed to make reversal signals both robust and transparent:
Dynamic z-score bands that expand or contract in real time to reflect current volatility regimes, ensuring the outer ±zThreshold levels always represent statistically rare extremes.
A smooth EMA baseline that weights recent price more heavily, serving as a fair-value anchor around which deviations are measured.
EMA-smoothed RSI slope confirmation, which filters out erratic momentum spikes by first smoothing raw RSI and then requiring its bar-to-bar slope to flip before any signal is allowed.
Slope-phase memory logic that locks out duplicate buy or sell markers until the RSI slope crosses back through zero, preventing over-trading during choppy swings.
Four distinct bar-coloring modes—Reversal Solid, Reversal Fade, Exceeding Bands, Classic Heat—plus a “None” option, so traders can choose whether to highlight the latest signal, show signal age, emphasize breakout bars, or view a continuous heat gradient within the bands.
A semi-transparent fill between the EMA and the upper/lower bands that visually frames the statistical zone and makes extremes immediately obvious.
Concise “Up” and “Down” labels that plot exactly when price re-enters a band with confirming momentum, keeping chart clutter to a minimum.
A real-time, five-metric scoring table (z-score, RSI slope, price vs. EMA, trend state, re-entry) that updates every two bars, displaying individual +1/–1/0 scores and an averaged Buy/Sell/Neutral verdict for complete transparency.
Calculations
Compute the fair-value EMA over fairLen bars.
Subtract that EMA from current price each bar to derive the raw deviation.
Over zLen bars, calculate the rolling mean and standard deviation of those deviations.
Convert each deviation into a z-score by subtracting the mean and dividing by the standard deviation.
Plot the upper and lower bands at ±zThreshold × standard deviation around the EMA.
Calculate raw RSI over rsiLen bars, then smooth it with an EMA of length rsiEmaLen.
Derive the RSI slope by taking the difference between the current and previous smoothed RSI.
Detect a potential reentry when price exits one of the bands on the prior bar and re-enters on the current bar.
Require that reentry coincide with an RSI slope flip (positive for a lower-band reentry, negative for an upper-band reentry).
On first valid reentry per momentum swing, fire a buy or sell signal and set a memory flag; reset that flag only when the RSI slope crosses back through zero.
For each bar, assign scores of +1, –1, or 0 for the z-score direction, RSI slope, price vs. EMA, trend-state, and reentry status.
Average those five scores; if the result exceeds +0.1, label “Buy,” if below –0.1, label “Sell,” otherwise “Neutral.”
Update bar colors, the semi-transparent fill, reversal labels, and the scoring table every two bars to reflect the latest calculations.
How It Actually Works
On each new candle, the EMA baseline and band widths update to reflect current volatility. The RSI is smoothed and its slope recalculated. The script then looks back one bar to see if price exited either band and forward to see if it reentered. If that reentry coincides with an appropriate RSI slope flip—and no signal has yet been generated in that swing—a concise label appears. Bar colors refresh according to your selected mode, and the scoring table updates to show which of the five conditions passed or failed, along with the overall verdict. This process repeats seamlessly at each bar, giving traders a continuous feed of disciplined, statistically filtered reversal cues.
Inputs
All parameters are fully user-configurable, allowing you to tailor sensitivity, lookbacks, and visuals to your trading style:
EMA length (fairLen): number of bars for the fair-value EMA; higher values smooth more but lag further behind price.
Z-Score lookback (zLen): window for calculating the mean and standard deviation of price deviations; longer lookbacks reduce noise but respond more slowly to new volatility.
Z-Score threshold (zThreshold): number of standard deviations defining the upper and lower bands; common default is 2.0 for roughly the outer 5 percent of moves.
Source (src): choice of price series (close, hl2, etc.) used for EMA, deviation, and RSI calculations.
RSI length (rsiLen): period for raw RSI calculation; shorter values react faster to momentum changes but can be choppier.
RSI EMA length (rsiEmaLen): period for smoothing raw RSI before taking its slope; higher values filter more noise.
Bar coloring mode (colorMode): select from None, Reversal Solid, Reversal Fade, Exceeding Bands, or Classic Heat to control how bars are shaded in relation to signals and band positions.
Show signals (showSignals): toggle on-chart “Up” and “Down” labels for reversal entries.
Show scoring table (enableTable): toggle the display of the five-metric breakdown table.
Table position (tablePos): choose which corner (Top Left, Top Right, Bottom Left, Bottom Right) hosts the scoring table.
Conclusion
By merging a normalized z-score framework, momentum slope confirmation, disciplined signal memory, flexible visuals, and transparent scoring into one Pine Script overlay, Uptrick: Z-Trend Bands offers a powerful yet intuitive tool for intraday mean-reversion trading. Its adaptability to real-time volatility and multi-layered filter logic deliver clear, high-confidence reversal cues without the clutter or confusion of simpler indicators.
Disclaimer
This indicator is provided solely for educational and informational purposes. It does not constitute financial advice. Trading involves substantial risk and may not be suitable for all investors. Past performance is not indicative of future results. Always conduct your own testing and apply careful risk management before trading live.

Ultimate Volatility CloudUltimate Volatility Cloud
The Ultimate Volatility Cloud is a powerful and highly customizable indicator designed to help traders visualize market volatility, easily identify trend, and overextended moves in price with adaptive bands. It combines the strengths of the Arnaud Legoux Moving Average, Kaufman's Adaptive Moving Average, ATR Channels, and Standard Deviation bands, offering multiple pre-configured profiles and extensive customization options.
Key Features:
Dynamic Volatility Bands: The indicator plots multiple layers of volatility bands around a central basis line, providing a comprehensive view of price deviation.
Hybrid Band Calculation: Bands are a sophisticated blend of Keltner Channels, KAMA ATR Channels and Standard Deviation, allowing for a nuanced representation of volatility.
Adaptive Smoothing: Bands are smoothed using either Exponential Moving Average (EMA) or Kaufman's Adaptive Moving Average (KAMA) based on the selected profile, ensuring responsiveness tailored to market conditions.
Layered Fills: The cloud uses distinct color fills for different volatility levels, making it easy to visually interpret price action relative to its typical range.
Customizable Color Themes: Choose from a variety of pre-set color themes, including "Rainbow," "Wild," and "Monochrome," or stick with classic options to suit your visual preference.
Optional Basis Line Plots: Display the EMA or KAMA basis lines (used in Keltner Channel calculations) separately on the chart for additional analysis.
Understanding the Profiles:
The indicator comes with several pre-configured "Settings Profiles" that adjust the internal parameters (Keltner Channel/KAMA Channel/Standard Deviation band blend, and band smoothing) to suit different trading styles or market environments.
1. Standard Profile:
Blend: 60% Keltner Channel, 40% Standard Deviation.
Smoothing: EMA smoothing of 3 periods.
Purpose: A balanced, general-purpose profile suitable for a wide range of market conditions. It offers a good blend of trend following and volatility awareness.
2. Responsive Profile:
Blend: 40% Keltner Channel, 60% Standard Deviation.
Smoothing: EMA smoothing of 2 period.
Purpose: Designed for traders who need quick reactions to price changes. The higher Standard Deviation blend and minimal smoothing make it highly sensitive to immediate volatility shifts, ideal for short-term analysis or identifying early moves.
3. Ranging Market Profile:
Blend: 80% KAMA ATR Channel, 20% Standard Deviation.
Smoothing: KAMA smoothing.
Purpose: Optimized for sideways or consolidating markets. By utilizing KAMA-based ATR bands and KAMA for band smoothing, this profile adapts its responsiveness to reduce whipsaws in choppy conditions, providing clearer boundaries for range-bound price action.
4. Trend Following Profile:
Blend: 90% Keltner Channel, 10% Standard Deviation.
Smoothing: EMA smoothing of 5 periods.
Purpose: Tailored for riding strong trends. The heavy emphasis on the Keltner Channel and slightly smoother bands help filter out minor fluctuations, allowing traders to focus on the dominant directional movement.
5. Conservative Profile:
Blend: 65% KAMA ATR Channel, 35% Standard Deviation.
Smoothing: EMA smoothing of 10 periods.
Purpose: Aims to provide more filtered signals and reduce noise. The KAMA basis for the Keltner Channel combined with a longer EMA smoothing period offers a slower, more confirmed view of volatility, suitable for traders seeking higher conviction entries or exits.
Example of the Ranging Market Profile
How to Use:
The volatility cloud can be interpreted in various ways:
Price within the inner bands: May indicate consolidation or a period of lower volatility.
Price pushing into outer bands: Suggests increasing volatility and potential for a strong move.
Price breaking out of extreme outer bands: Can signal significant momentum and the start or continuation of a strong trend.
Cloud expansion/contraction: Visually indicates periods of increasing or decreasing market energy.
Experiment with different profiles and settings to find the combination that best suits your trading strategy and the instruments you trade.

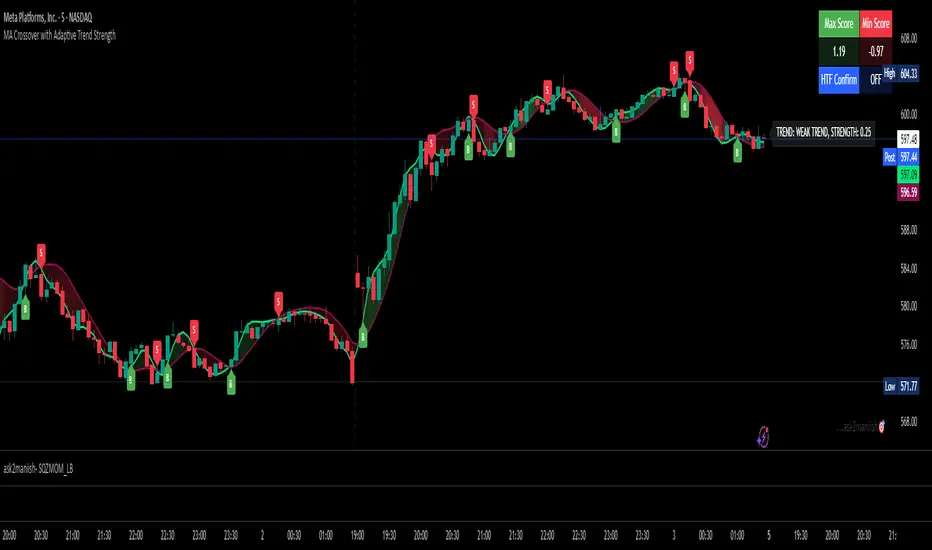
MA Crossover with Adaptive Trend Strength📘 MA Crossover with Adaptive Trend Strength —
📌 Overview
This TradingView indicator plots two moving averages (Fast & Slow) with user-selected types (T3, EMA, SMA, HMA), visual crossovers, and dynamically calculates an adaptive trend strength score using Z-scores of multiple features. Optional higher timeframe (HTF) confirmation is supported. A color-filled region between the MAs visually indicates momentum direction.
⚙️ Inputs & Controls
📈 Moving Average Settings
Fast MA Length: Length of the fast-moving average (default: 9).
Slow MA Length: Length of the slow-moving average (default: 21).
MA Type: Type of moving average used (T3, EMA, SMA, HMA).
Source: Input data source (default: close).
T3 Volume Factor: Only used when T3 is selected, controls smoothing (range: 0–1).
🎨 Visual Controls
Bullish Fill Color: Fill color when Fast MA is above Slow MA.
Bearish Fill Color: Fill color when Fast MA is below Slow MA.
Show Gradient Fill: Enable or disable the colored area between Fast & Slow MAs.
Trend Label Position: Choose where the trend strength label appears (top or bottom).
Label Update Interval: Number of bars between label updates (reduces clutter).
⏱ Multi-Timeframe Support
Higher Timeframe: Timeframe used for confirmation (default: 60 min).
Use HTF Confirmation: Enables filtering of trend score by higher timeframe trend direction.
📊 Lookback Configuration
Auto Lookback Based on Timeframe: Dynamically adapts scoring lookback period per chart timeframe.
Manual Lookback: Manual fallback lookback length when auto is off.
🧮 MA Calculation Options
T3 MA: Custom T3 function with exponential moving averages and volume factor.
EMA/SMA: Built-in Pine functions (ta.ema, ta.sma).
HMA: Hull Moving Average using WMA calculations.
📉 Trend Strength Calculation
🧠 Z-Score Inputs
Distance between MAs (zDist)
Slope of the Fast MA (zSlope)
Volume (zVol)
ATR (zATR)
📏 Choppiness & Adaptive Weighting
A Choppiness Index (based on ATR & price range) reduces score impact in sideways markets.
Dynamically adjusts Z-score weights:
W1: Distance
W2: Slope
W3: Volume
W4: ATR
🔁 HTF Confirmation
Optionally multiplies the trend score by the direction of the higher timeframe trend to filter noise.
🟩 Plot & Visual Elements
📊 MA Lines
Plots Fast and Slow MA lines in colors based on selected MA type.
🌈 Gradient Fill
Fills the area between Fast and Slow MAs with opacity proportional to their difference.
Colors based on bullish/bearish condition.
🏷️ Trend Strength Label
Updates every n bars (Label Update Interval).
Shows:
Trend Classification: Weak, Moderate, Strong
Numerical Score
Label position (top or bottom) is configurable.
🔔 Crossover Signals
Bullish Crossover ("B"): Fast MA crosses above Slow MA.
Bearish Crossover ("S"): Fast MA crosses below Slow MA.
Labels are plotted at crossover points.
Old labels are removed after a threshold (100) to reduce chart clutter.
📋 Score Summary Table
A table showing:
Max Score within the lookback period
Min Score
HTF Confirmation Status (ON / OFF)
Updates on the same user-defined interval as the trend label.
🚨 Alerts
Condition Description
Bullish MA Cross Fast MA crosses above Slow MA
Bearish MA Cross Fast MA crosses below Slow MA
These are provided via alertcondition() for use in alert creation.
📌 Customization Tips
Turn off the gradient fill for a cleaner chart.
Use HTF confirmation to reduce false positives in ranging markets.
Adjust label update frequency to prevent visual clutter on faster timeframes.
Use T3 MA with volume factor for smoother signals in volatile markets.
OrangeCandle 4EMA 55 + Fib Bands + SignalsThe script is a TradingView indicator that combines three popular technical analysis tools: Exponential Moving Averages (EMAs), Fibonacci bands, and buy/sell signals based on these indicators. Here’s a breakdown of its features:
1. EMA Settings and Calculation:
The script calculates and plots several Exponential Moving Averages (EMAs) on the chart with different lengths:
Short-term EMAs: EMA 9, EMA 13, EMA 21, and EMA 55 (used for tracking short-term price trends).
Long-term EMAs: EMA 100 and EMA 200 (used to analyze longer-term trends).
These EMAs are plotted with different colors to visually distinguish between the short-term and long-term trends.
2. Fibonacci Bands:
The script calculates Fibonacci Bands based on the Average True Range (ATR) and a Simple Moving Average (SMA).
Fibonacci factors (1.618, 2.618, 4.236, 6.854, and 11.090) are used to determine the upper and lower bounds of five Fibonacci bands.
Upper Fibonacci Bands (e.g., fib1u, fib2u) represent resistance levels.
Lower Fibonacci Bands (e.g., fib1l, fib2l) represent support levels.
These bands are plotted with different colors for each level, helping traders identify potential price reversal zones.
3. Buy and Sell Signals:
Long Condition: A buy signal occurs when the price crosses above the EMA 55 (long-term trend indicator) and is above the lower Fibonacci band (support zone).
Short Condition: A sell signal occurs when the price crosses below the EMA 55 and is below the upper Fibonacci band (resistance zone).
These conditions trigger visual signals on the chart (green arrow for long, red arrow for short).
4. Alerts:
The script includes alert conditions to notify the trader when a long or short signal is triggered based on the crossover of price and EMA 55 near the Fibonacci support or resistance levels.
Long Entry Alert: Triggers when the price crosses above the EMA 55 and is near a Fibonacci support level.
Short Entry Alert: Triggers when the price crosses below the EMA 55 and is near a Fibonacci resistance level.
5. Visualization:
EMAs are plotted with distinct colors:
EMA 9 is aqua,
EMA 13 is purple,
EMA 21 is orange,
EMA 55 is blue (with thicker line width for emphasis),
EMA 100 is gray,
EMA 200 is black.
Fibonacci bands are plotted with different colors for each level:
Fib Band 1 (upper and lower) in white,
Fib Band 2 in green (upper) and red (lower),
Fib Band 3 in green (upper) and red (lower),
Fib Band 4 in blue (upper) and orange (lower),
Fib Band 5 in purple (upper) and yellow (lower).
Summary:
This script provides a comprehensive strategy for analyzing the market with multiple EMAs for trend detection, Fibonacci bands for support/resistance, and signals based on price action in relation to these indicators. The combination of these tools can assist traders in making more informed decisions by providing potential entry and exit points on the chart.

Cumulative New Highs - New Lows IndicatorThis indicator is designed to track market momentum by calculating and plotting the cumulative sum of 52 weeks High-Low for different indices, alongside a customizable moving average.
Index Selection:
Users can choose from multiple indices, including:
Total Stock Market (default)
NYSE Composite
Nasdaq Composite
S&P 500
Nasdaq 100
Russell 2000
Moving Average Customization:
The script allows you to select between a Simple Moving Average (SMA) or an Exponential Moving Average (EMA) for smoothing the cumulative data. The window length of the moving average is also adjustable, letting you tailor the sensitivity of the trend analysis.
Dynamic Background Plotting:
With the background plot option enabled, the indicator changes the chart's background color dynamically:
Green: When the cumulative sum is above its moving average, suggesting bullish momentum.
Red: When it is below the moving average, indicating bearish conditions.
Visual Representation:
Two key lines are plotted:
Cumulative Index Line: Displayed in a subtle blue, representing the aggregated market movement.
Moving Average Line: Shown in an orange tone, offering a smoothed perspective that aids in identifying trend shifts.
Inspiration:
I took inspiration from the indicator made by YoxTrades (I can't put links, but you can check their profile) and added a few features I wanted on top of it.

Weekly MA SuiteThe Weekly MA Suite is a multi-layered moving average indicator designed for traders and investors who analyze market trends across weekly and long-term timeframes. It combines three critical trend layers—short-term (1W EMA/VWMA), mid-term (30W EMA/VWMA), and long-term (200W HMA)—providing clear insights into market momentum, structure, and cycle trends.
This indicator is ideal for:
✅ Swing traders looking for weekly momentum shifts
✅ Position traders tracking multi-week to multi-month trends
✅ Long-term investors monitoring macro market cycles
Each layer has customizable colors, transparency, and visibility toggles, ensuring traders can tailor the indicator to their specific needs.
📊 Breakdown of Components
🔹 Short-Term Trend (1W EMA/VWMA Ribbon – Top Layer)
Purpose: Captures weekly momentum and volume dynamics
• 1W EMA (Exponential Moving Average) reacts quickly to price changes
• 1W VWMA (Volume-Weighted Moving Average) accounts for volume to confirm trend strength
• Ribbon fill highlights the divergence between price-based momentum (EMA) and volume-weighted trends (VWMA), making trend shifts easier to spot
Usage:
• If the 1W EMA is above the 1W VWMA, momentum is strong and price is trending higher with support from volume
• If the EMA crosses below the VWMA, it may indicate weakening trend strength or distribution
• A widening ribbon suggests increasing momentum, while a narrowing ribbon signals potential consolidation or reversal
🔸 Mid-Term Trend (30W EMA/VWMA Ribbon – Middle Layer)
Purpose: Provides insight into the broader market structure over multiple months
• 30W EMA represents the dominant trend direction over roughly half a year
• 30W VWMA smooths this trend while weighting price by trading volume
• Ribbon fill allows for a visual representation of how volume impacts trend direction
Usage:
• A bullish trend is confirmed when price remains above the 30W EMA, with the ribbon widening in an uptrend
• A bearish shift occurs when the 30W EMA crosses below the 30W VWMA, signaling weakening demand
• If the ribbon narrows or twists frequently, the market may be in a choppy, range-bound phase
🔻 Long-Term Trend (200W HMA – Background Layer)
Purpose: Identifies major market cycles and deep trend shifts
• The 200W Hull Moving Average (HMA) is a long-term smoothing tool that reduces lag while maintaining trend clarity
• Unlike traditional moving averages, the HMA reacts faster to trend changes without excessive noise
Usage:
• When price is above the 200W HMA, the broader trend remains bullish, even during short-term corrections
• A cross below the 200W HMA may indicate a macro downtrend or deep market cycle shift
• Long-term investors can use this as a dynamic support or resistance zone
🎯 How to Use the Weekly MA Suite for Trading
📅 Identifying Market Phases
• In strong uptrends, the 1W EMA and 30W EMA will be aligned above their VWMA counterparts, with price well above the 200W HMA
• In sideways markets, the ribbons will frequently narrow or cross, signaling indecision
• In bear markets, price will typically trade below the 30W EMA, with the 200W HMA acting as a long-term resistance
📈 Entry and Exit Strategies
• A bullish trade setup occurs when the 1W EMA crosses above the 1W VWMA while the 30W EMA holds above the 30W VWMA, confirming multi-timeframe momentum
• A bearish setup is confirmed when the 1W EMA crosses below the 1W VWMA and price is also trending below the 30W EMA
• The 200W HMA can be used as a trend filter—staying long when price is above it and avoiding longs when price is below
🚦 Customizing for Your Trading Style
• Scalpers can focus on the 1W ribbon for faster trend shifts
• Swing traders can use the 30W ribbon for trend-following entries and exits
• Long-term investors should watch price action relative to the 200W HMA for market cycle positioning
🔧 Final Thoughts
The Weekly MA Suite simplifies multi-timeframe analysis by layering key moving averages in an intuitive and structured format. By combining short, medium, and long-term trend indicators, traders can confidently navigate market conditions and improve decision-making. Whether trading weekly trends or monitoring multi-year cycles, this tool provides a clear visual framework to enhance market insights.

Smoothed EMA LinesThe "Smoothed EMA Lines" script is a technical analysis tool designed to help traders identify trends and potential support/resistance levels in financial markets. The script plots exponential moving averages (EMAs) of the closing price for five commonly used time periods: 8, 13, 21, 55, and 200.
Key features of the script include:
Overlay: The EMAs are plotted directly on the price chart, making it easy to analyze the relationship between the moving averages and price action.
Smoothing: The script applies an additional smoothing function to each EMA, using a simple moving average (SMA) of a user-defined length. This helps to reduce noise and provide a clearer picture of the trend.
Customizable lengths: Users can easily adjust the length of each EMA and the smoothing period through the script's input parameters.
Color-coded plots: Each EMA is assigned a unique color (8: blue, 13: green, 21: orange, 55: red, 200: purple) for easy identification on the chart.
Traders can use the "Smoothed EMA Lines" script to:
Identify the overall trend direction (bullish, bearish, or neutral) based on the arrangement of the EMAs.
Spot potential support and resistance levels where the price may interact with the EMAs.
Look for crossovers between EMAs as potential entry or exit signals.
Combine the EMA analysis with other technical indicators and price action patterns for a more comprehensive trading strategy.
The "Smoothed EMA Lines" script provides a clear, customizable, and easy-to-interpret visualization of key exponential moving averages, helping traders make informed decisions based on trend analysis.

EMA Alignment & Spread Monitor (Sang Youn)Overview
The EMA Alignment & Spread Monitor is a dynamic trading script designed to monitor EMA (Exponential Moving Average) alignments, track spread deviations, and provide real-time alerts when significant conditions are met. This script allows traders to customize their EMA periods, analyze market trends based on EMA positioning, and receive visual and audio alerts when key spread conditions occur.
🔹 Key Features
✅ Customizable EMA Periods – Users can input their own EMA lengths to adapt the script to various market conditions. (Default: 5, 10, 20, 60, 120)
✅ EMA Alignment Detection – Identifies bullish alignment (all EMAs in ascending order) and bearish alignment (all EMAs in descending order).
✅ Spread Calculation & Monitoring – Computes the spread difference between each EMA and tracks the average spread over a user-defined period.
✅ Deviation Alerts – Notifies traders when:
Bullish Trend: The spread exceeds its average, indicating a potential strong uptrend.
Bearish Trend: The spread falls below its average, signaling a possible downtrend.
✅ Chart Annotations – Displays 📈 (green triangle) when bullish spread exceeds average and 📉 (red triangle) when bearish spread drops below average for easy visualization.
✅ Real-time Alerts – Sends alerts when spread conditions are met, helping traders react to market shifts efficiently.
✅ Spread Histogram – Visual representation of bullish and bearish spread levels for trend analysis.
🔹 How It Works
1️⃣ Set your EMA periods in the script settings (default: 5, 10, 20, 60, 120).
2️⃣ Define the spread average calculation length (default: 50 candles).
3️⃣ The script tracks EMA alignment to determine bullish or bearish trends.
4️⃣ If the spread deviates significantly from its average, the script:
Places a 📈 green triangle above candles in a bullish trend when spread > average.
Places a 📉 red triangle below candles in a bearish trend when spread < average.
Triggers an alert for timely decision-making.
5️⃣ Use the histogram & real-time alerts to stay ahead of market movements.
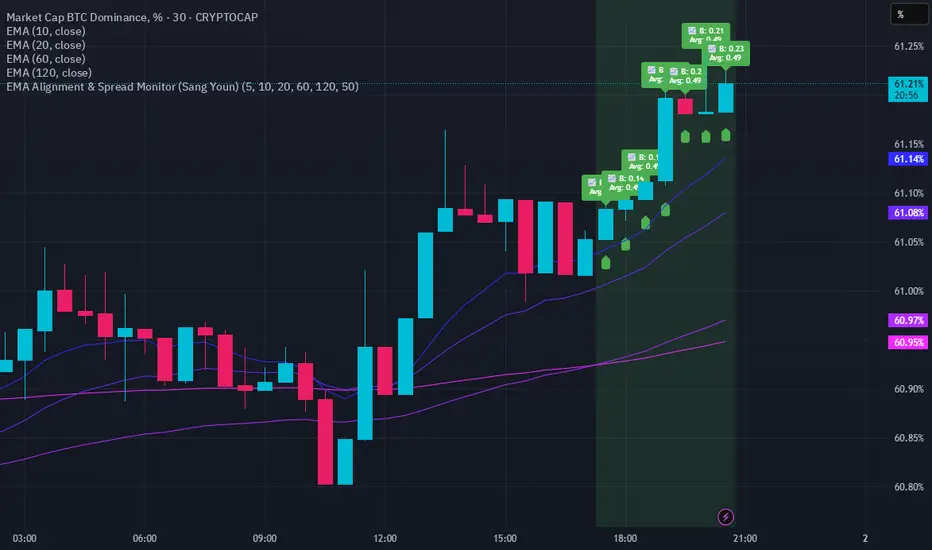
MACD+RSI Indicator Moving Average Convergence/Divergence or MACD is a momentum indicator that shows the relationship between two Exponential Moving Averages (EMAs) of a stock price. Convergence happens when two moving averages move toward one another, while divergence occurs when the moving averages move away from each other. This indicator also helps traders to know whether the stock is being extensively bought or sold. Its ability to identify and assess short-term price movements makes this indicator quite useful.
The Moving Average Convergence/Divergence indicator was invented by Gerald Appel in 1979.
Moving Average Convergence/Divergence is calculated using a 12-day EMA and 26-day EMA. It is important to note that both the EMAs are based on closing prices. The convergence and divergence (CD) values have to be calculated first. The CD value is calculated by subtracting the 26-day EMA from the 12-day EMA.
---------------------------------------------------------------------------------------------------------------------
The relative strength index (RSI) is a momentum indicator used in technical analysis. RSI measures the speed and magnitude of a security's recent price changes to detect overbought or oversold conditions in the price of that security.
The RSI is displayed as an oscillator (a line graph) on a scale of zero to 100. The indicator was developed by J. Welles Wilder Jr. and introduced in his seminal 1978 book, New Concepts in Technical Trading Systems.
In addition to identifying overbought and oversold securities, the RSI can also indicate securities that may be primed for a trend reversal or a corrective pullback in price. It can signal when to buy and sell. Traditionally, an RSI reading of 70 or above indicates an overbought condition. A reading of 30 or below indicates an oversold condition.
---------------------------------------------------------------------------------------------------------------------
By combining them, you can create a MACD/RSI strategy. You can go ahead and search for MACD/RSI strategy on any social platform. It is so powerful that it is the most used indicator in TradingView. It is best for trending market. Our indicator literally let you customize MACD/RSI settings. Explore our indicator by applying to your chart and start trading now!

MA Deviation with Volatility ThresholdsPrice Deviation from MA with Dynamic Thresholds - TradingView Script Description
Overview
The Price Deviation from Moving Average (MA) with Dynamic Thresholds indicator is designed to measure and visualize how far the current price deviates from a chosen moving average (SMA or EMA) in percentage terms. It provides traders with valuable insights into whether the asset is significantly overbought or oversold relative to its historical mean.
One of the standout features of this indicator is its ability to dynamically adjust overbought and oversold thresholds based on historical volatility, making it more adaptable across different asset classes and market conditions.
Key Features
✅ Customizable Moving Average
Choose between Simple Moving Average (SMA) or Exponential Moving Average (EMA).
Adjustable MA period (default: 200).
Select the timeframe for the MA calculation (default: Daily).
✅ Percentage-Based Deviation Measurement
Measures how much the price has deviated from the selected moving average in percentage terms.
Helps to identify extreme price movements relative to historical trends.
✅ Static & Dynamic Overbought/Oversold Thresholds
Static Thresholds: Users can set fixed percentage levels for overbought and oversold conditions (default: ±20%).
Dynamic Thresholds (enabled by default): Automatically adjust based on historical volatility.
Uses standard deviation of price changes over a specified period (default: 200 candles).
Thresholds are calculated as volatility × a user-defined multiplier (default: 10).
✅ Visual Enhancements
Background Highlighting:
Red when the price exceeds the overbought threshold.
Green when the price drops below the oversold threshold.
Area Chart Representation: The deviation is plotted as a filled orange area (30% opacity) to enhance visual clarity.
Zero Line in Yellow: Helps in quickly identifying when the price is near the moving average.
How to Use
📌 Trend Confirmation & Mean Reversion Trading:
If the deviation is consistently positive, it indicates an uptrend, while negative values suggest a downtrend.
If the price significantly deviates from the MA and enters the overbought/oversold zone, a potential mean reversion opportunity may arise.
📌 Volatility-Adaptive Thresholds:
When enabled, dynamic thresholds help to adjust for different asset volatilities.
Suitable for traders dealing with assets that exhibit varying levels of price fluctuations.
📌 Combining with Other Indicators:
Works well with RSI, Bollinger Bands, and MACD to confirm trend strength or potential reversals.
Can be used in conjunction with support & resistance levels for added confirmation.
Customization Options
Moving Average Type: SMA or EMA.
Moving Average Period & Timeframe Selection.
Static Overbought/Oversold Levels.
Dynamic Thresholds:
Toggle ON/OFF.
Set the Lookback Period for volatility calculation.
Adjust the Volatility Multiplier for fine-tuning threshold sensitivity.
Why Use This Indicator?
🔹 Adaptive to Different Markets: Works with stocks, forex, crypto, commodities, and indices.
🔹 Useful for Both Trend-Following & Mean Reversion Strategies.
🔹 Volatility-Based Adjustments Ensure Market-Relevant Thresholds.
🔹 Enhances Market Awareness by Identifying Extreme Price Deviations.
Final Thoughts
The Price Deviation from MA with Dynamic Thresholds indicator is a powerful tool for traders who want to gauge price extremes and identify potential turning points in the market. With both static and dynamic threshold options, it can be tailored to different trading styles and asset behaviors.
💡 Tip: Experiment with different MA types, periods, and volatility multipliers to find settings that best suit your preferred trading strategy. 🚀
[SHORT ONLY] Consecutive Bars Above MA Strategy█ STRATEGY DESCRIPTION
The "Consecutive Bars Above MA Strategy" is a contrarian trading system aimed at exploiting overextended bullish moves in stocks and ETFs. It monitors the number of consecutive bars that close above a chosen short-term moving average (which can be either a Simple Moving Average or an Exponential Moving Average). Once the count reaches a preset threshold and the current bar’s close exceeds the previous bar’s high within a designated trading window, a short entry is initiated. An optional EMA filter further refines entries by requiring that the current close is below the 200-period EMA, helping to ensure that trades are taken in a bearish environment.
█ HOW ARE THE CONSECUTIVE BULLISH COUNTS CALCULATED?
The strategy utilizes a counter variable, `bullCount`, to track consecutive bullish bars based on their relation to the short-term moving average. Here’s how the count is determined:
Initialize the Counter
The counter is initialized at the start:
var int bullCount = na
Bullish Bar Detection
For each bar, if the close is above the selected moving average (either SMA or EMA, based on user input), the counter is incremented:
bullCount := close > signalMa ? (na(bullCount) ? 1 : bullCount + 1) : 0
Reset on Non-Bullish Condition
If the close does not exceed the moving average, the counter resets to zero, indicating a break in the consecutive bullish streak.
█ SIGNAL GENERATION
1. SHORT ENTRY
A short signal is generated when:
The number of consecutive bullish bars (i.e., bars closing above the short-term MA) meets or exceeds the defined threshold (default: 3).
The current bar’s close is higher than the previous bar’s high.
The signal occurs within the specified trading window (between Start Time and End Time).
Additionally, if the EMA filter is enabled, the entry is only executed when the current close is below the 200-period EMA.
2. EXIT CONDITION
An exit signal is triggered when the current close falls below the previous bar’s low, prompting the strategy to close the short position.
█ ADDITIONAL SETTINGS
Threshold: The number of consecutive bullish bars required to trigger a short entry (default is 3).
Trading Window: The Start Time and End Time inputs define when the strategy is active.
Moving Average Settings: Choose between SMA and EMA, and set the MA length (default is 5), which is used to assess each bar’s bullish condition.
EMA Filter (Optional): When enabled, this filter requires that the current close is below the 200-period EMA, supporting entries in a downtrend.
█ PERFORMANCE OVERVIEW
This strategy is designed for stocks and ETFs and can be applied across various timeframes.
It seeks to capture mean reversion by shorting after a series of bullish bars suggests an overextended move.
The approach employs a contrarian short entry by waiting for a breakout (close > previous high) following consecutive bullish bars.
The adjustable moving average settings and optional EMA filter allow for further optimization based on market conditions.
Comprehensive backtesting is recommended to fine-tune the threshold, moving average parameters, and filter settings for optimal performance.

ATR Trailing Stop by GideonMATR Trailing Stop Indicator
This ATR Trailing Stop Indicator is designed for traders who wish to enhance their exit strategies by leveraging volatility-based stops. It offers a systematic approach to trend management and risk control, enabling traders to capture extended trends while protecting their capital during market reversals. Works on Indian Indices as well.
Overview:
The ATR Trailing Stop indicator is a dynamic trend-following tool that adjusts stop levels based on market volatility. By incorporating the Average True Range (ATR), the indicator provides a flexible exit strategy that adapts to changing market conditions, helping traders lock in profits during trends and limit losses during reversals.
How It Works:
True Range and ATR Calculation:
The indicator first calculates the True Range (TR) for each bar, defined as the maximum of:
The difference between the high and low,
The absolute difference between the high and the previous close, and
The absolute difference between the low and the previous close.
Using the TR values, the ATR is computed over a user-defined period (default is 14 bars) with an option to use either a Simple Moving Average (SMA) or an Exponential Moving Average (EMA) as the smoothing method.
Trailing Stop Determination:
Two potential stop levels are calculated:
For an uptrend, the stop is determined as:
Stop = Close – (Multiplier × ATR)
For a downtrend, the stop is:
Stop = Close + (Multiplier × ATR)
The indicator maintains a persistent trailing stop that dynamically adjusts:
In an uptrend, the trailing stop only moves upward (or remains flat) to secure gains.
In a downtrend, it only moves downward, thereby protecting the position from excessive losses.
A reversal in trend is identified when the price crosses the trailing stop level, at which point the indicator flips the trend and resets the stop level accordingly.
Rationale:
Utilizing the ATR for trailing stops ensures that the stop levels are directly influenced by market volatility. This dynamic adjustment helps accommodate the natural price fluctuations of the market, providing a more adaptive risk management tool compared to fixed stop-loss levels. The approach is particularly useful in volatile markets where traditional static stops might be triggered prematurely.
Customization:
Key parameters that can be adjusted include:
ATR Period: The number of bars used to calculate the ATR.
ATR Multiplier: The factor that determines how far the trailing stop is set from the current price.
Smoothing Method: Option to choose between SMA and EMA for ATR calculation, allowing traders to tailor the sensitivity of the indicator to their specific trading style.

Arpeet MACDOverview
This strategy is based on the zero-lag version of the MACD (Moving Average Convergence Divergence) indicator, which captures short-term trends by quickly responding to price changes, enabling high-frequency trading. The strategy uses two moving averages with different periods (fast and slow lines) to construct the MACD indicator and introduces a zero-lag algorithm to eliminate the delay between the indicator and the price, improving the timeliness of signals. Additionally, the crossover of the signal line and the MACD line is used as buy and sell signals, and alerts are set up to help traders seize trading opportunities in a timely manner.
Strategy Principle
Calculate the EMA (Exponential Moving Average) or SMA (Simple Moving Average) of the fast line (default 12 periods) and slow line (default 26 periods).
Use the zero-lag algorithm to double-smooth the fast and slow lines, eliminating the delay between the indicator and the price.
The MACD line is formed by the difference between the zero-lag fast line and the zero-lag slow line.
The signal line is formed by the EMA (default 9 periods) or SMA of the MACD line.
The MACD histogram is formed by the difference between the MACD line and the signal line, with blue representing positive values and red representing negative values.
When the MACD line crosses the signal line from below and the crossover point is below the zero axis, a buy signal (blue dot) is generated.
When the MACD line crosses the signal line from above and the crossover point is above the zero axis, a sell signal (red dot) is generated.
The strategy automatically places orders based on the buy and sell signals and triggers corresponding alerts.
Advantage Analysis
The zero-lag algorithm effectively eliminates the delay between the indicator and the price, improving the timeliness and accuracy of signals.
The design of dual moving averages can better capture market trends and adapt to different market environments.
The MACD histogram intuitively reflects the comparison of bullish and bearish forces, assisting in trading decisions.
The automatic order placement and alert functions make it convenient for traders to seize trading opportunities in a timely manner, improving trading efficiency.
Risk Analysis
In volatile markets, frequent crossover signals may lead to overtrading and losses.
Improper parameter settings may cause signal distortion and affect strategy performance.
The strategy relies on historical data for calculations and has poor adaptability to sudden events and black swan events.
Optimization Direction
Introduce trend confirmation indicators, such as ADX, to filter out false signals in volatile markets.
Optimize parameters to find the best combination of fast and slow line periods and signal line periods, improving strategy stability.
Combine other technical indicators or fundamental factors to construct a multi-factor model, improving risk-adjusted returns of the strategy.
Introduce stop-loss and take-profit mechanisms to control single-trade risk.
Summary
The MACD Dual Crossover Zero Lag Trading Strategy achieves high-frequency trading by quickly responding to price changes and capturing short-term trends. The zero-lag algorithm and dual moving average design improve the timeliness and accuracy of signals. The strategy has certain advantages, such as intuitive signals and convenient operation, but also faces risks such as overtrading and parameter sensitivity. In the future, the strategy can be optimized by introducing trend confirmation indicators, parameter optimization, multi-factor models, etc., to improve the robustness and profitability of the strategy.
